PCSOFT Blog
Tip of the Week: Use People Graphs in Excel for Data Visualization

With Microsoft Excel, you can use visuals to represent your data, providing greater context for the contents of your spreadsheets and making it easier to communicate what it all means. This week’s tip focuses on People Graphs, a feature that can be powerful when used appropriately.
Explaining People Graphs
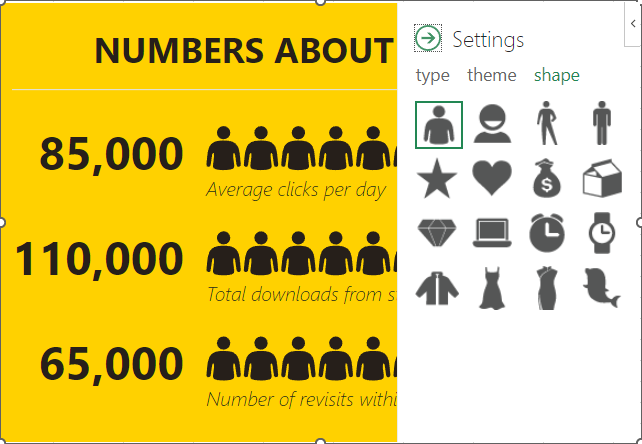
One of the Microsoft Office Add-Ins your organization can use is the option to use People Graphs for data visualization. The default icon is a person, but you can also customize it with various icons like stars, hearts, clocks, bags of money, or otherwise.
Here’s how you can make a People Graph using a simple set of data.
How to Create a People Graph
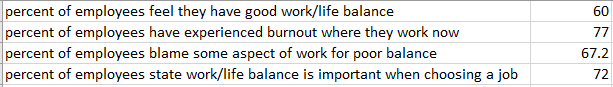
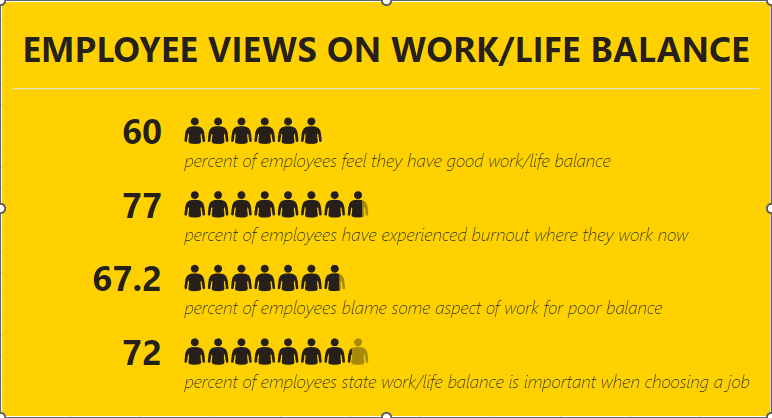
The first thing you need to make a People Graph is the spreadsheet from which it will pull its data. For example, let's say you wanted to share some statistics about the work/life balance of today’s workforce. You might list out the statistics in one column, then include the actual numeric values for those statistics in another column.
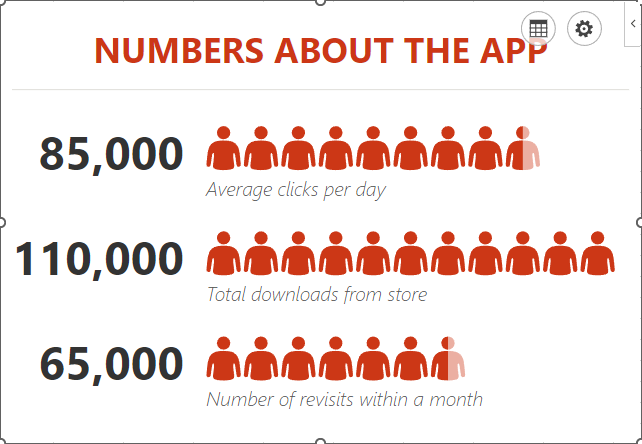
Once you have your spreadsheet ready to go, select the data range. Then, using the Insert toolbar, find the option for People Graph. It will be located in Add-Ins. You’ll see a premade graph populate on the sheet. You can then use the Settings option from the top-right corner of the graph to make any adjustments you need to it.
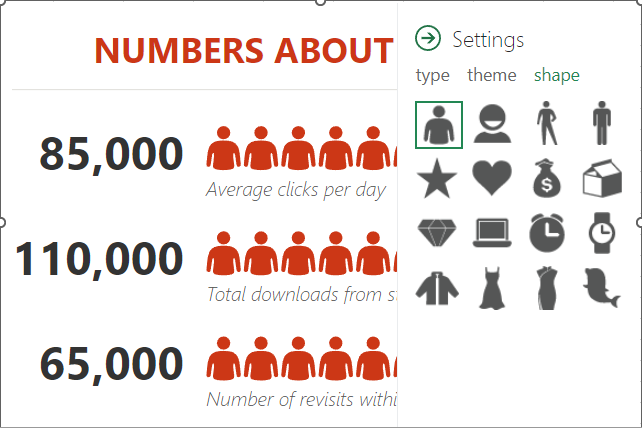
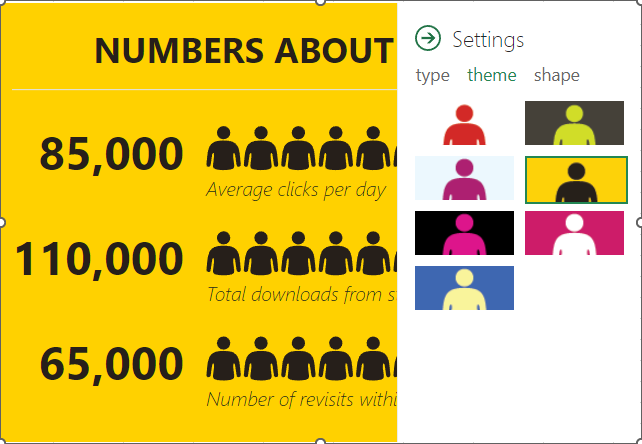
You have a fair amount of control over how the graph looks, including its color scheme and the shape of the icons.
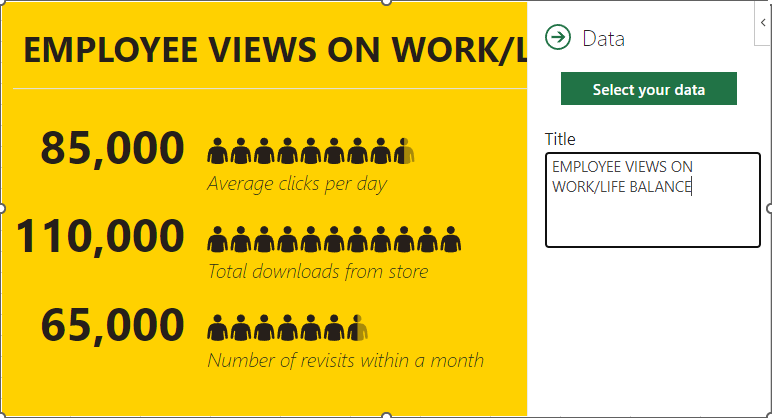
After you’ve customized it to your liking, you can select the grid button next to the Settings. You can use this to customize the title of your graph or the data that it pulls its information from.
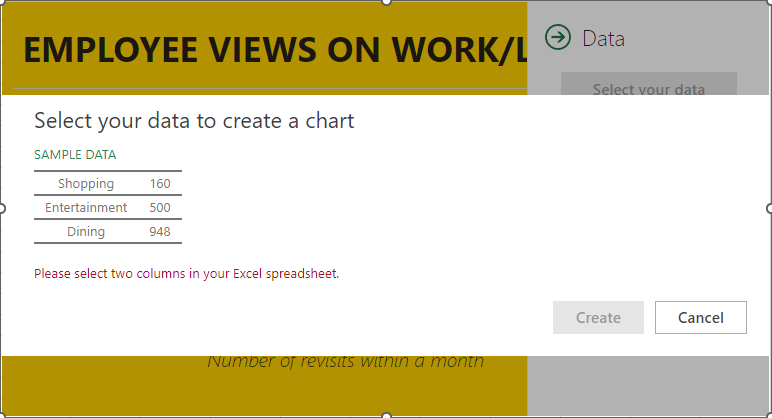
Once you have selected the data, all you have to do is click on Create. This will complete your People Graph.
Did you find this helpful? We’re full of neat tips and tricks, so be sure to keep an eye on our blog for more.
About the author

Comments